
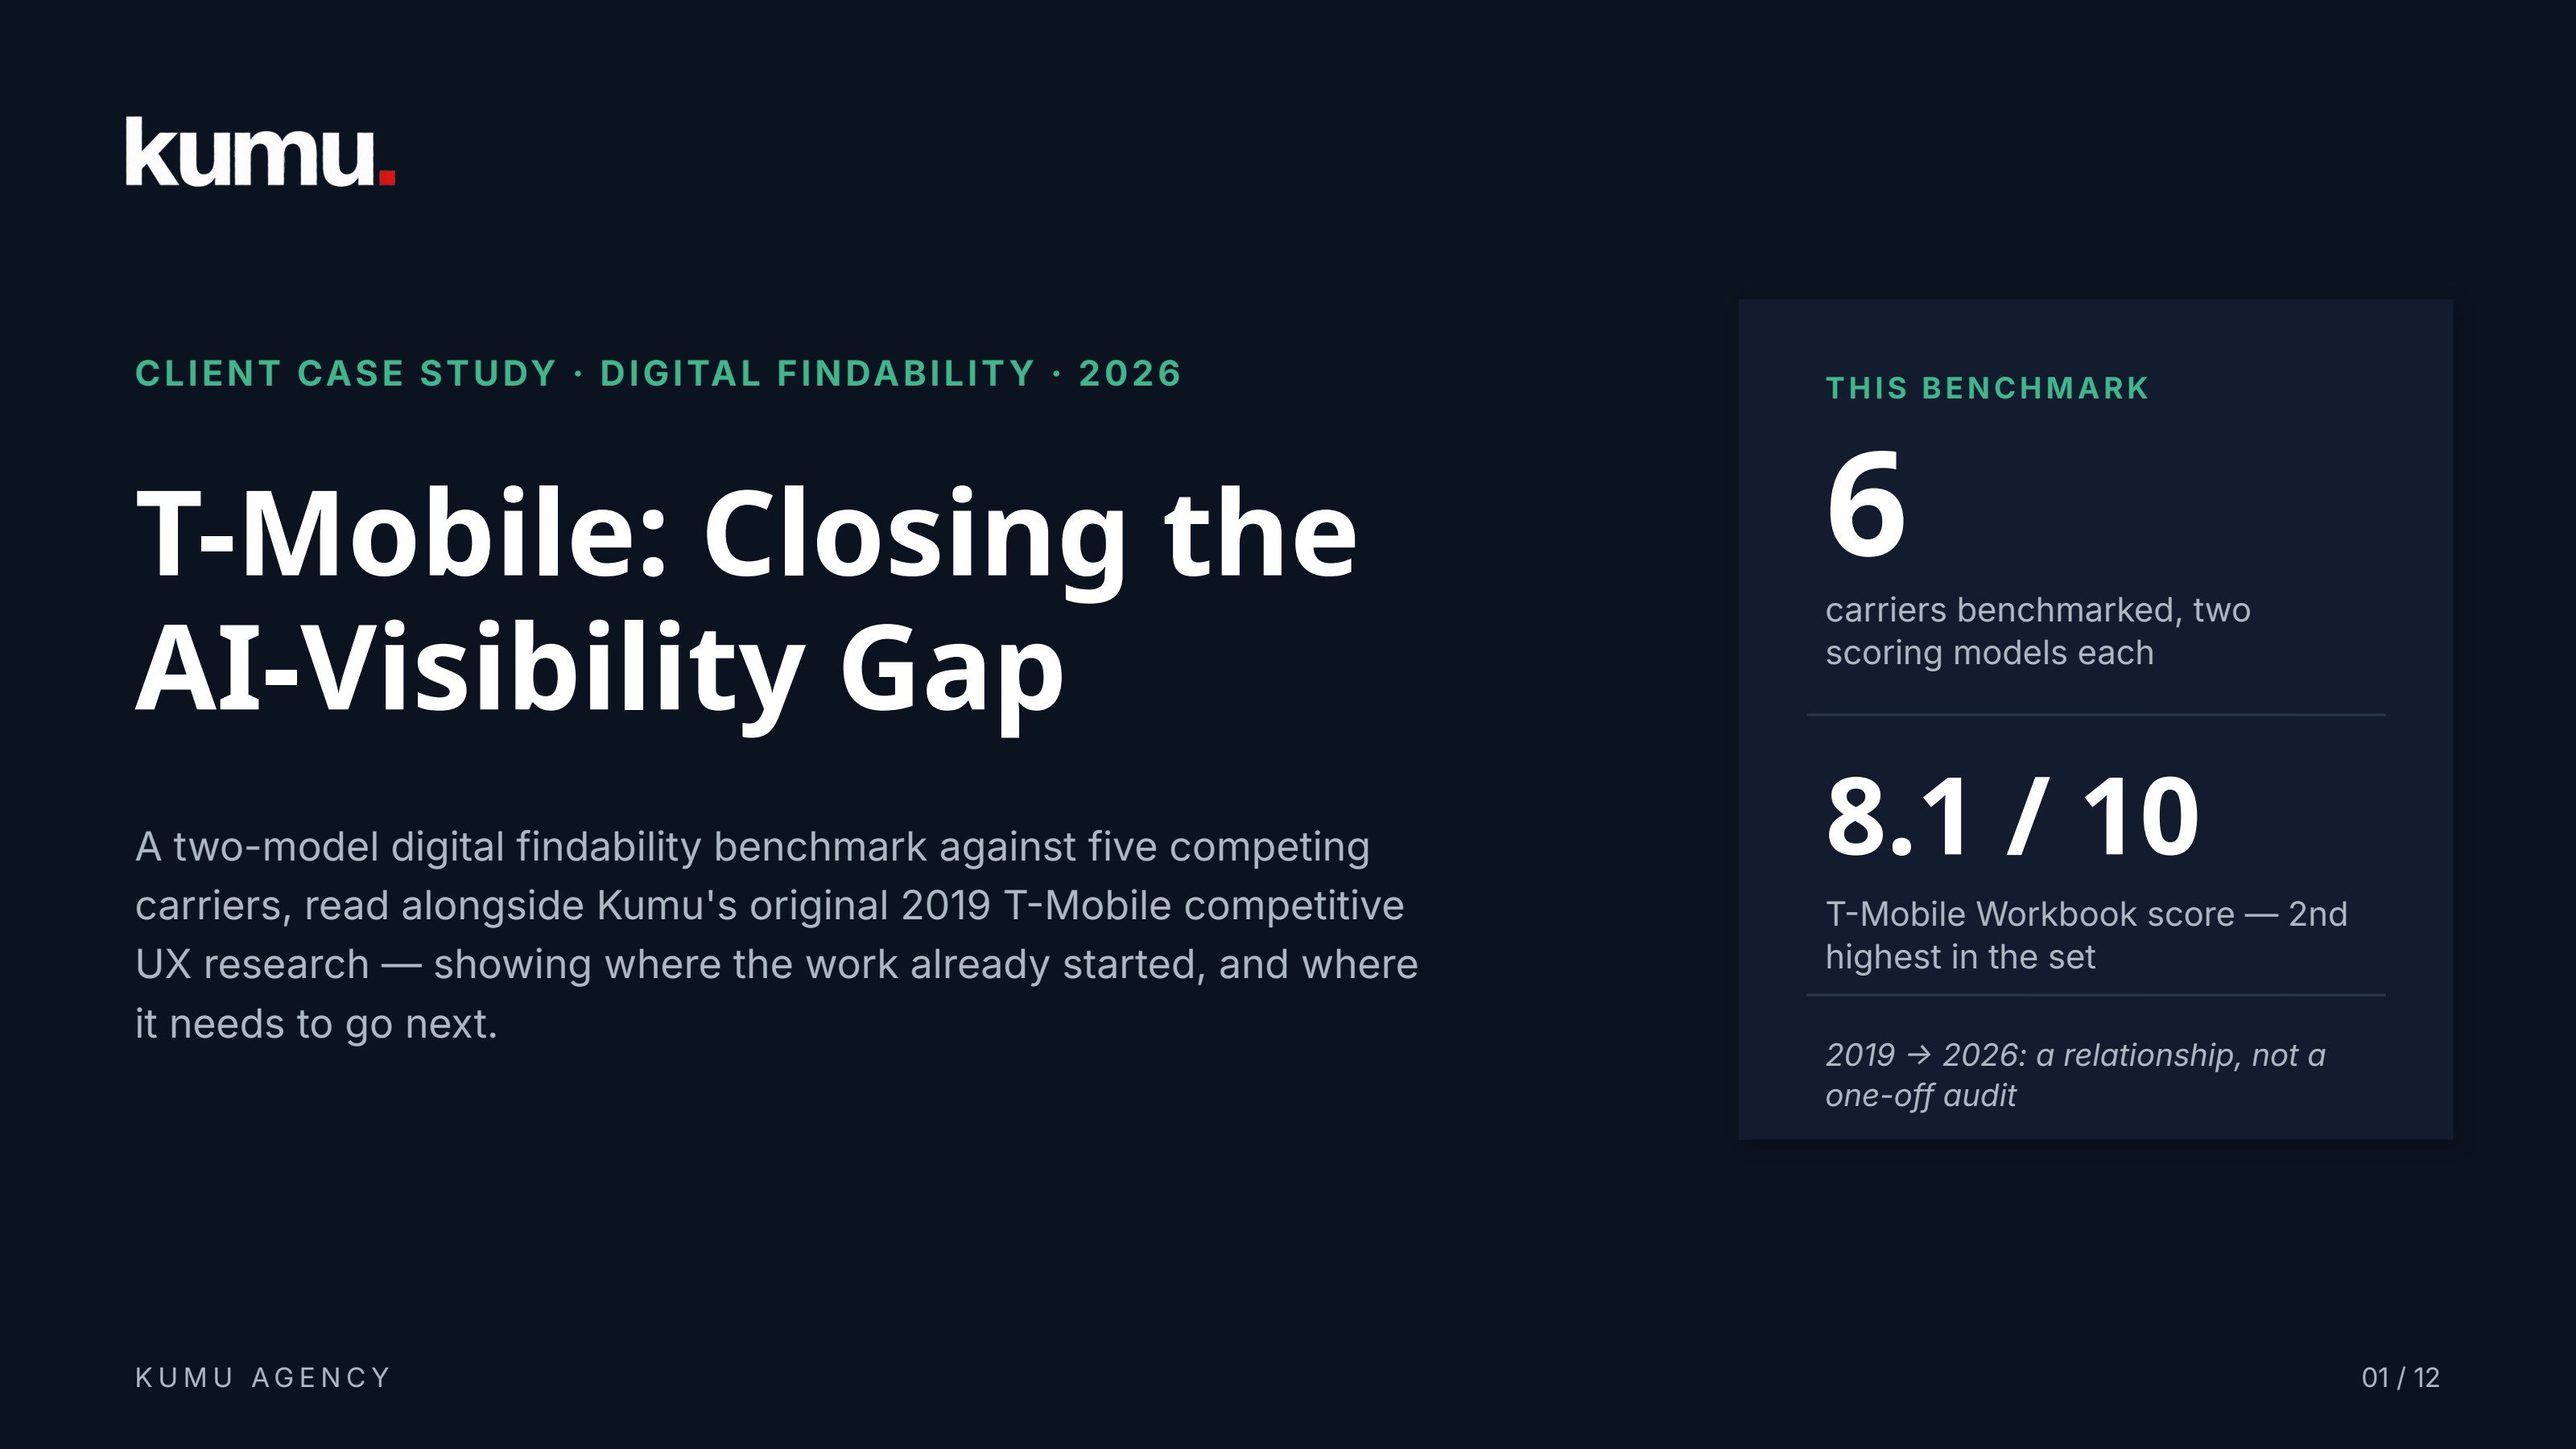
T-Mobile
Closing the AI-visibility gap
From a 2019 competitive UX review to the 2026 Kumu Digital Findability Benchmark — a seven-year partnership measured in scores T-Mobile can act on.
Services
T-Mobile scored second out of six major US carriers in the 2026 Digital Findability Benchmark. A single, actionable gap separates them from the leader — built on seven years of UX research, user testing, and heuristic audits.
01
Context
Search stopped being a list of links. Buyers comparing carriers increasingly get a single synthesized answer — from Google's AI Overview, ChatGPT or Perplexity — instead of ten blue links. A switcher who never sees T-Mobile inside that answer is a switcher T-Mobile never had a chance to win. The 2026 Kumu Digital Findability Benchmark was built to measure exactly that: how findable, citable and answer-ready each major US carrier actually is — and where T-Mobile sits in the new game.
02
Methodology
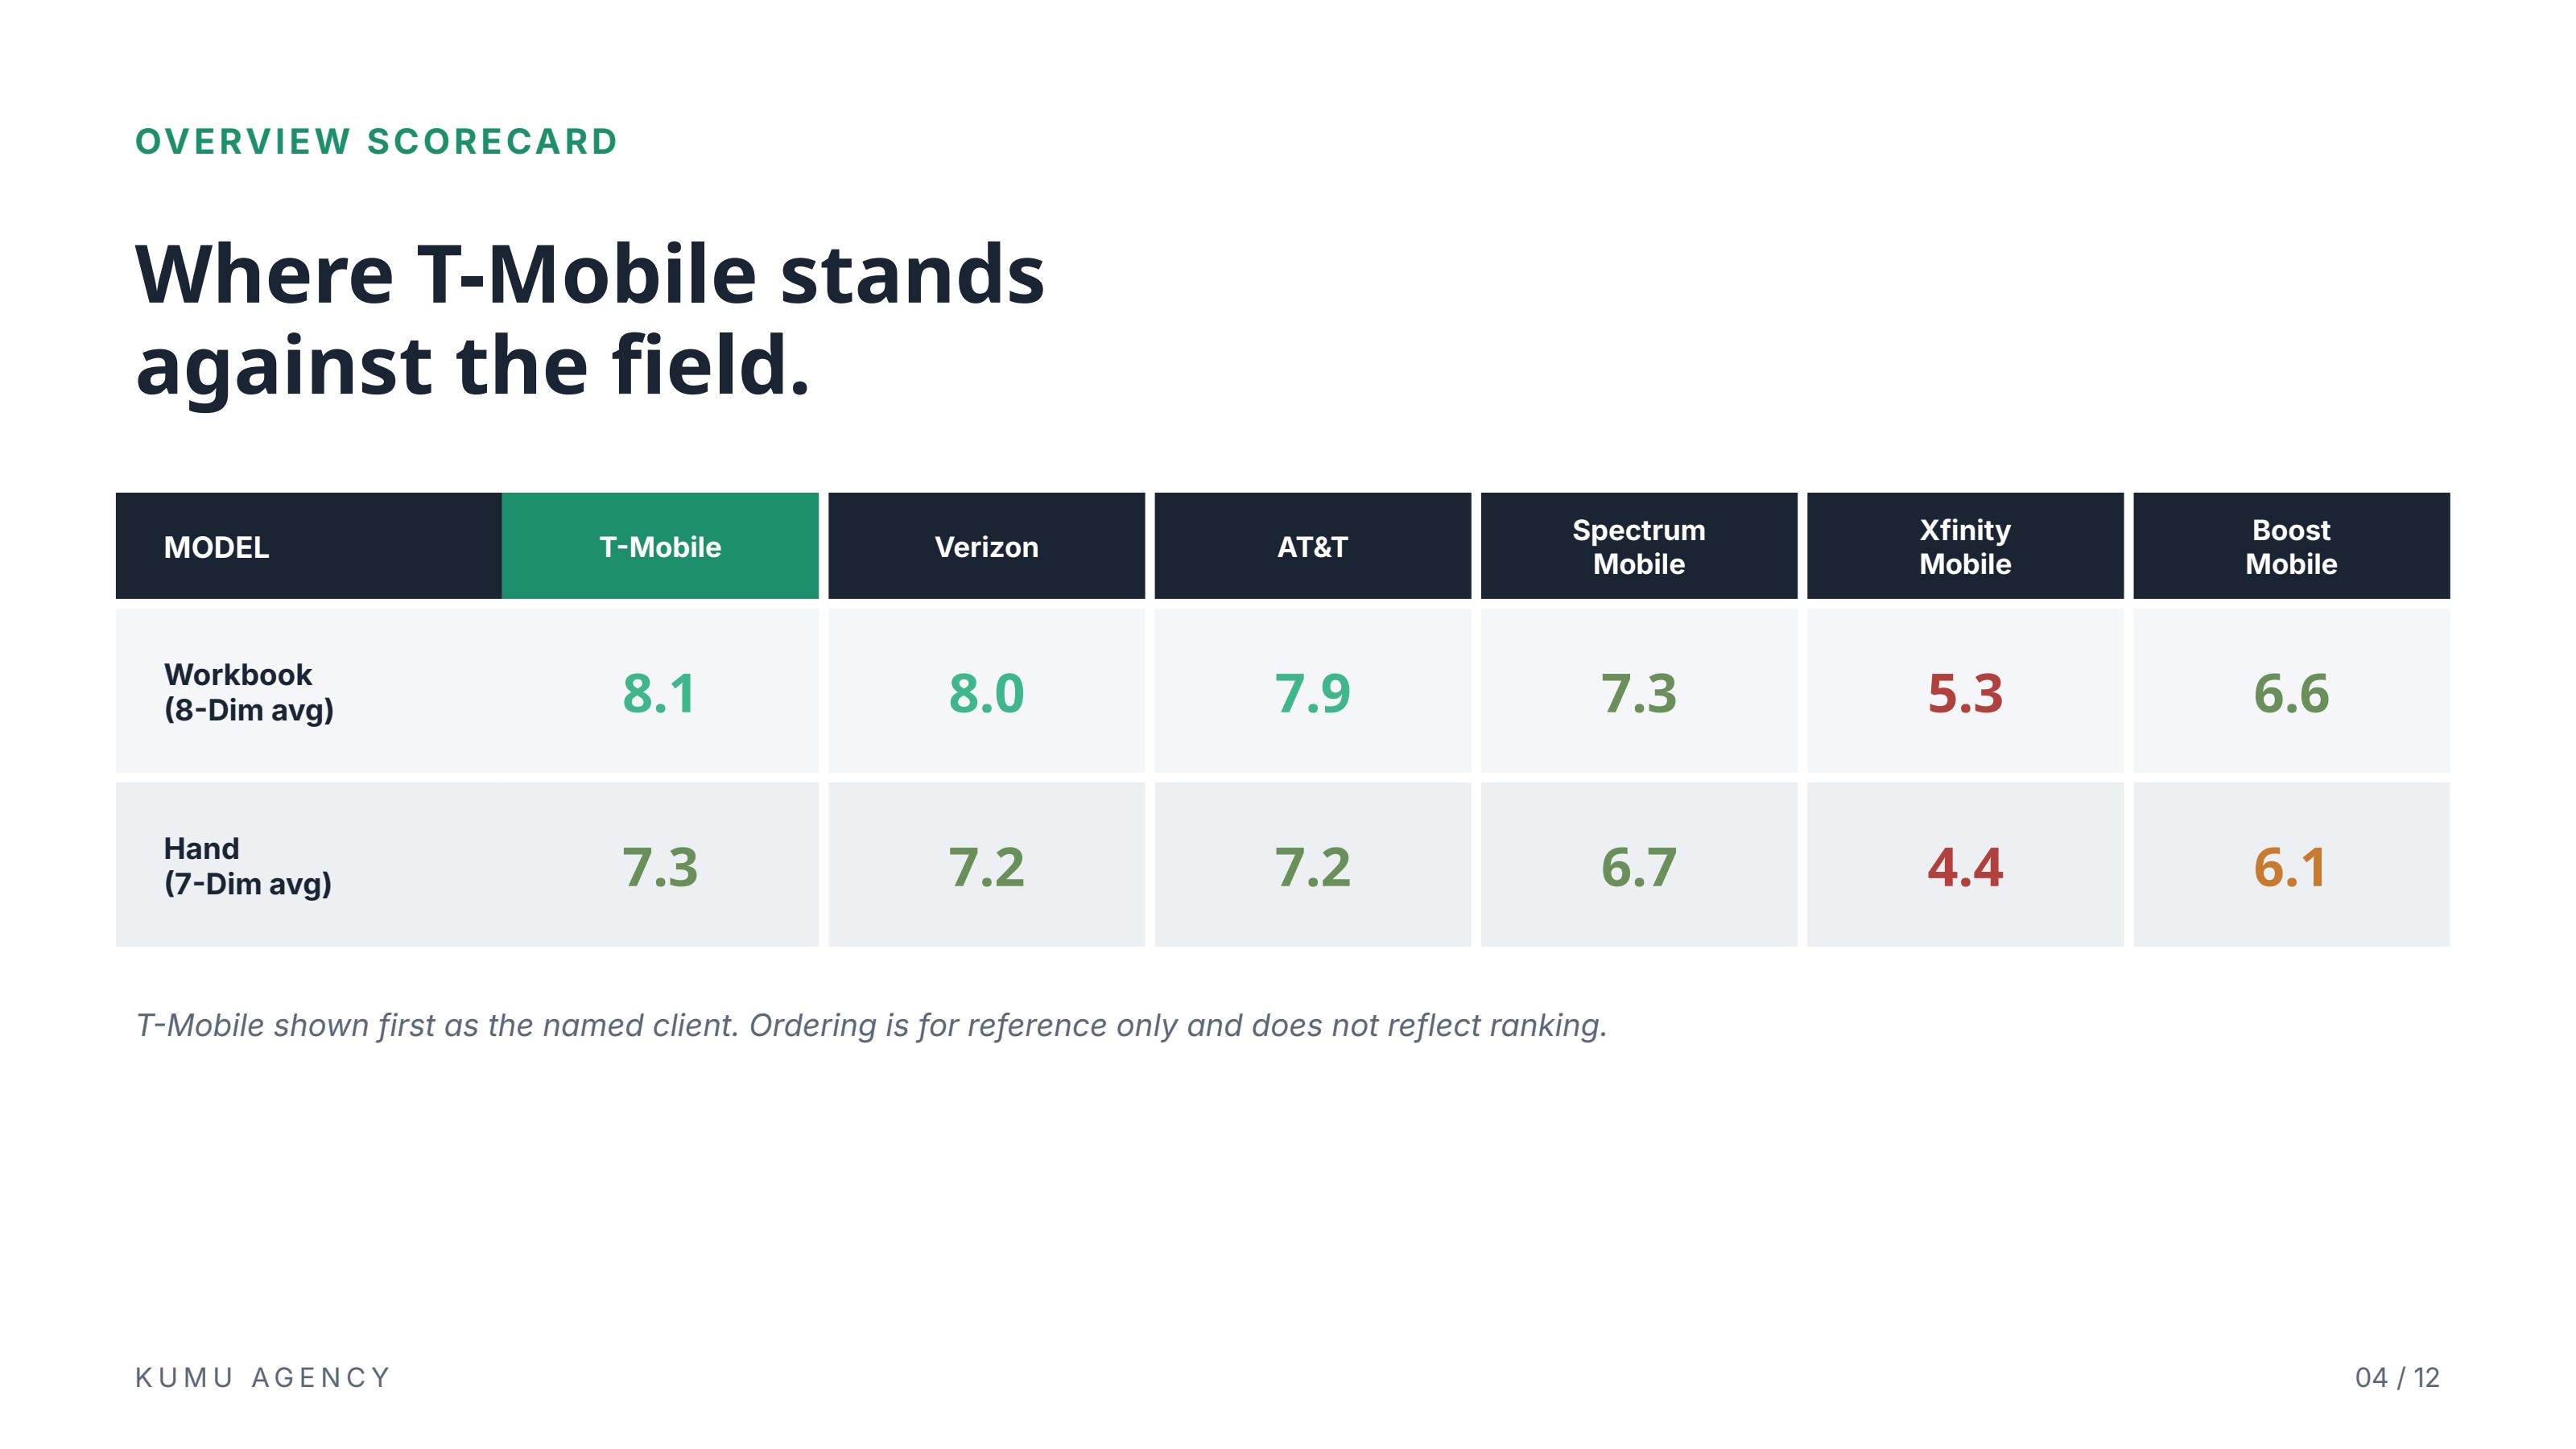
We benchmarked six carriers — T-Mobile, Verizon, AT&T, Spectrum Mobile, Xfinity Mobile and Boost Mobile — using two intentionally different scoring models run side by side. The Workbook model scores eight dimensions of structural completeness (technical SEO, local SEO, plan findability, AI/LLM visibility, UX, social, reviews, conversion). The Hand model scores seven dimensions of manual quality judgment — whether content actually differentiates the brand, whether it's fresh, whether AI visibility is substantive rather than just present. The gap between the two models is itself a finding.
03
The broader engagement
Findability is one slice of a much larger program. Kumu provides T-Mobile with ongoing UX/UI design, moderated and unmoderated user testing, focus groups across switcher and existing-customer audiences, NN/g-grounded heuristic audits of the plans, phones, promotions and checkout flows, and named-competitor benchmarking against the rest of the carrier set. Every recommendation we publish is backed by direct site evidence — the same evidentiary standard whether we're scoring an llms.txt file in 2026 or a plan-comparison page in 2019.
04
What we found in 2026
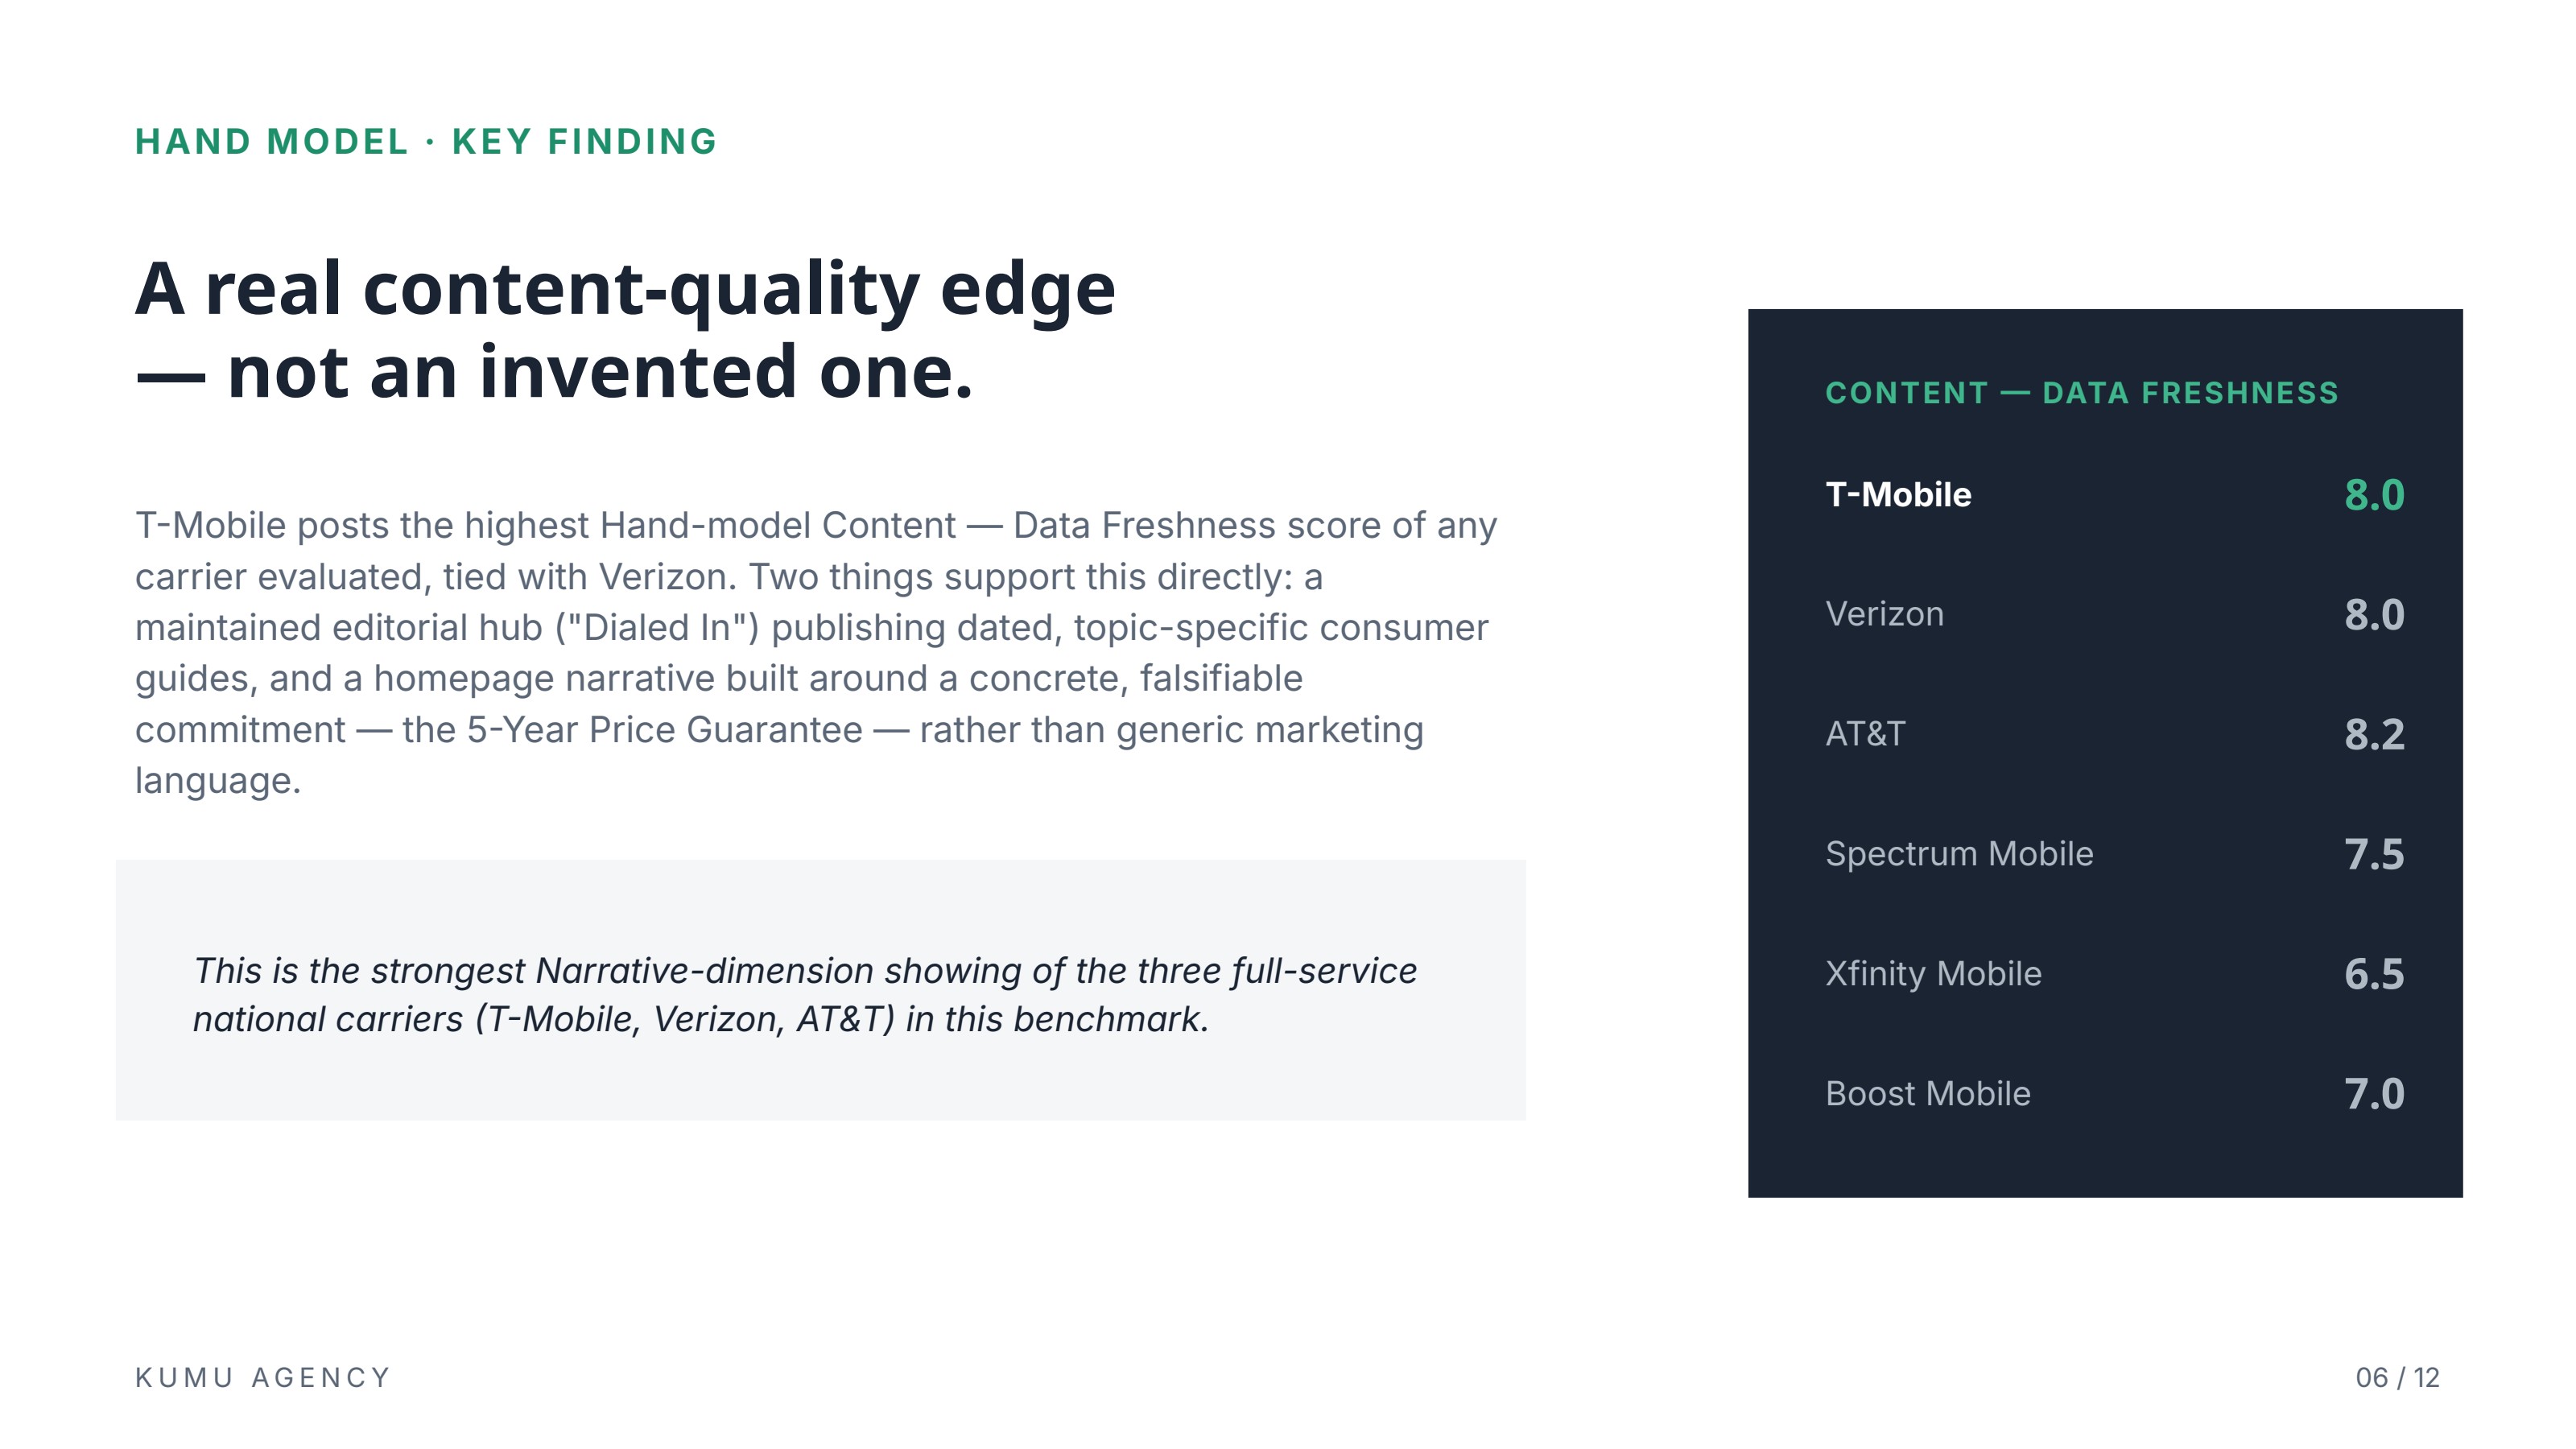
T-Mobile posted the second-highest Workbook score in the set (8.1/10) and the second-highest Hand score (7.3/10), behind only Verizon by a fraction. The real edge showed up in content: T-Mobile tied for the highest data-freshness score of any carrier — built on a maintained editorial hub ("Dialed In") and a homepage narrative anchored to a concrete, falsifiable promise (the 5-Year Price Guarantee) rather than generic marketing language. That is the strongest Narrative-dimension showing of the three full-service national carriers in this benchmark.
05
The honest gap
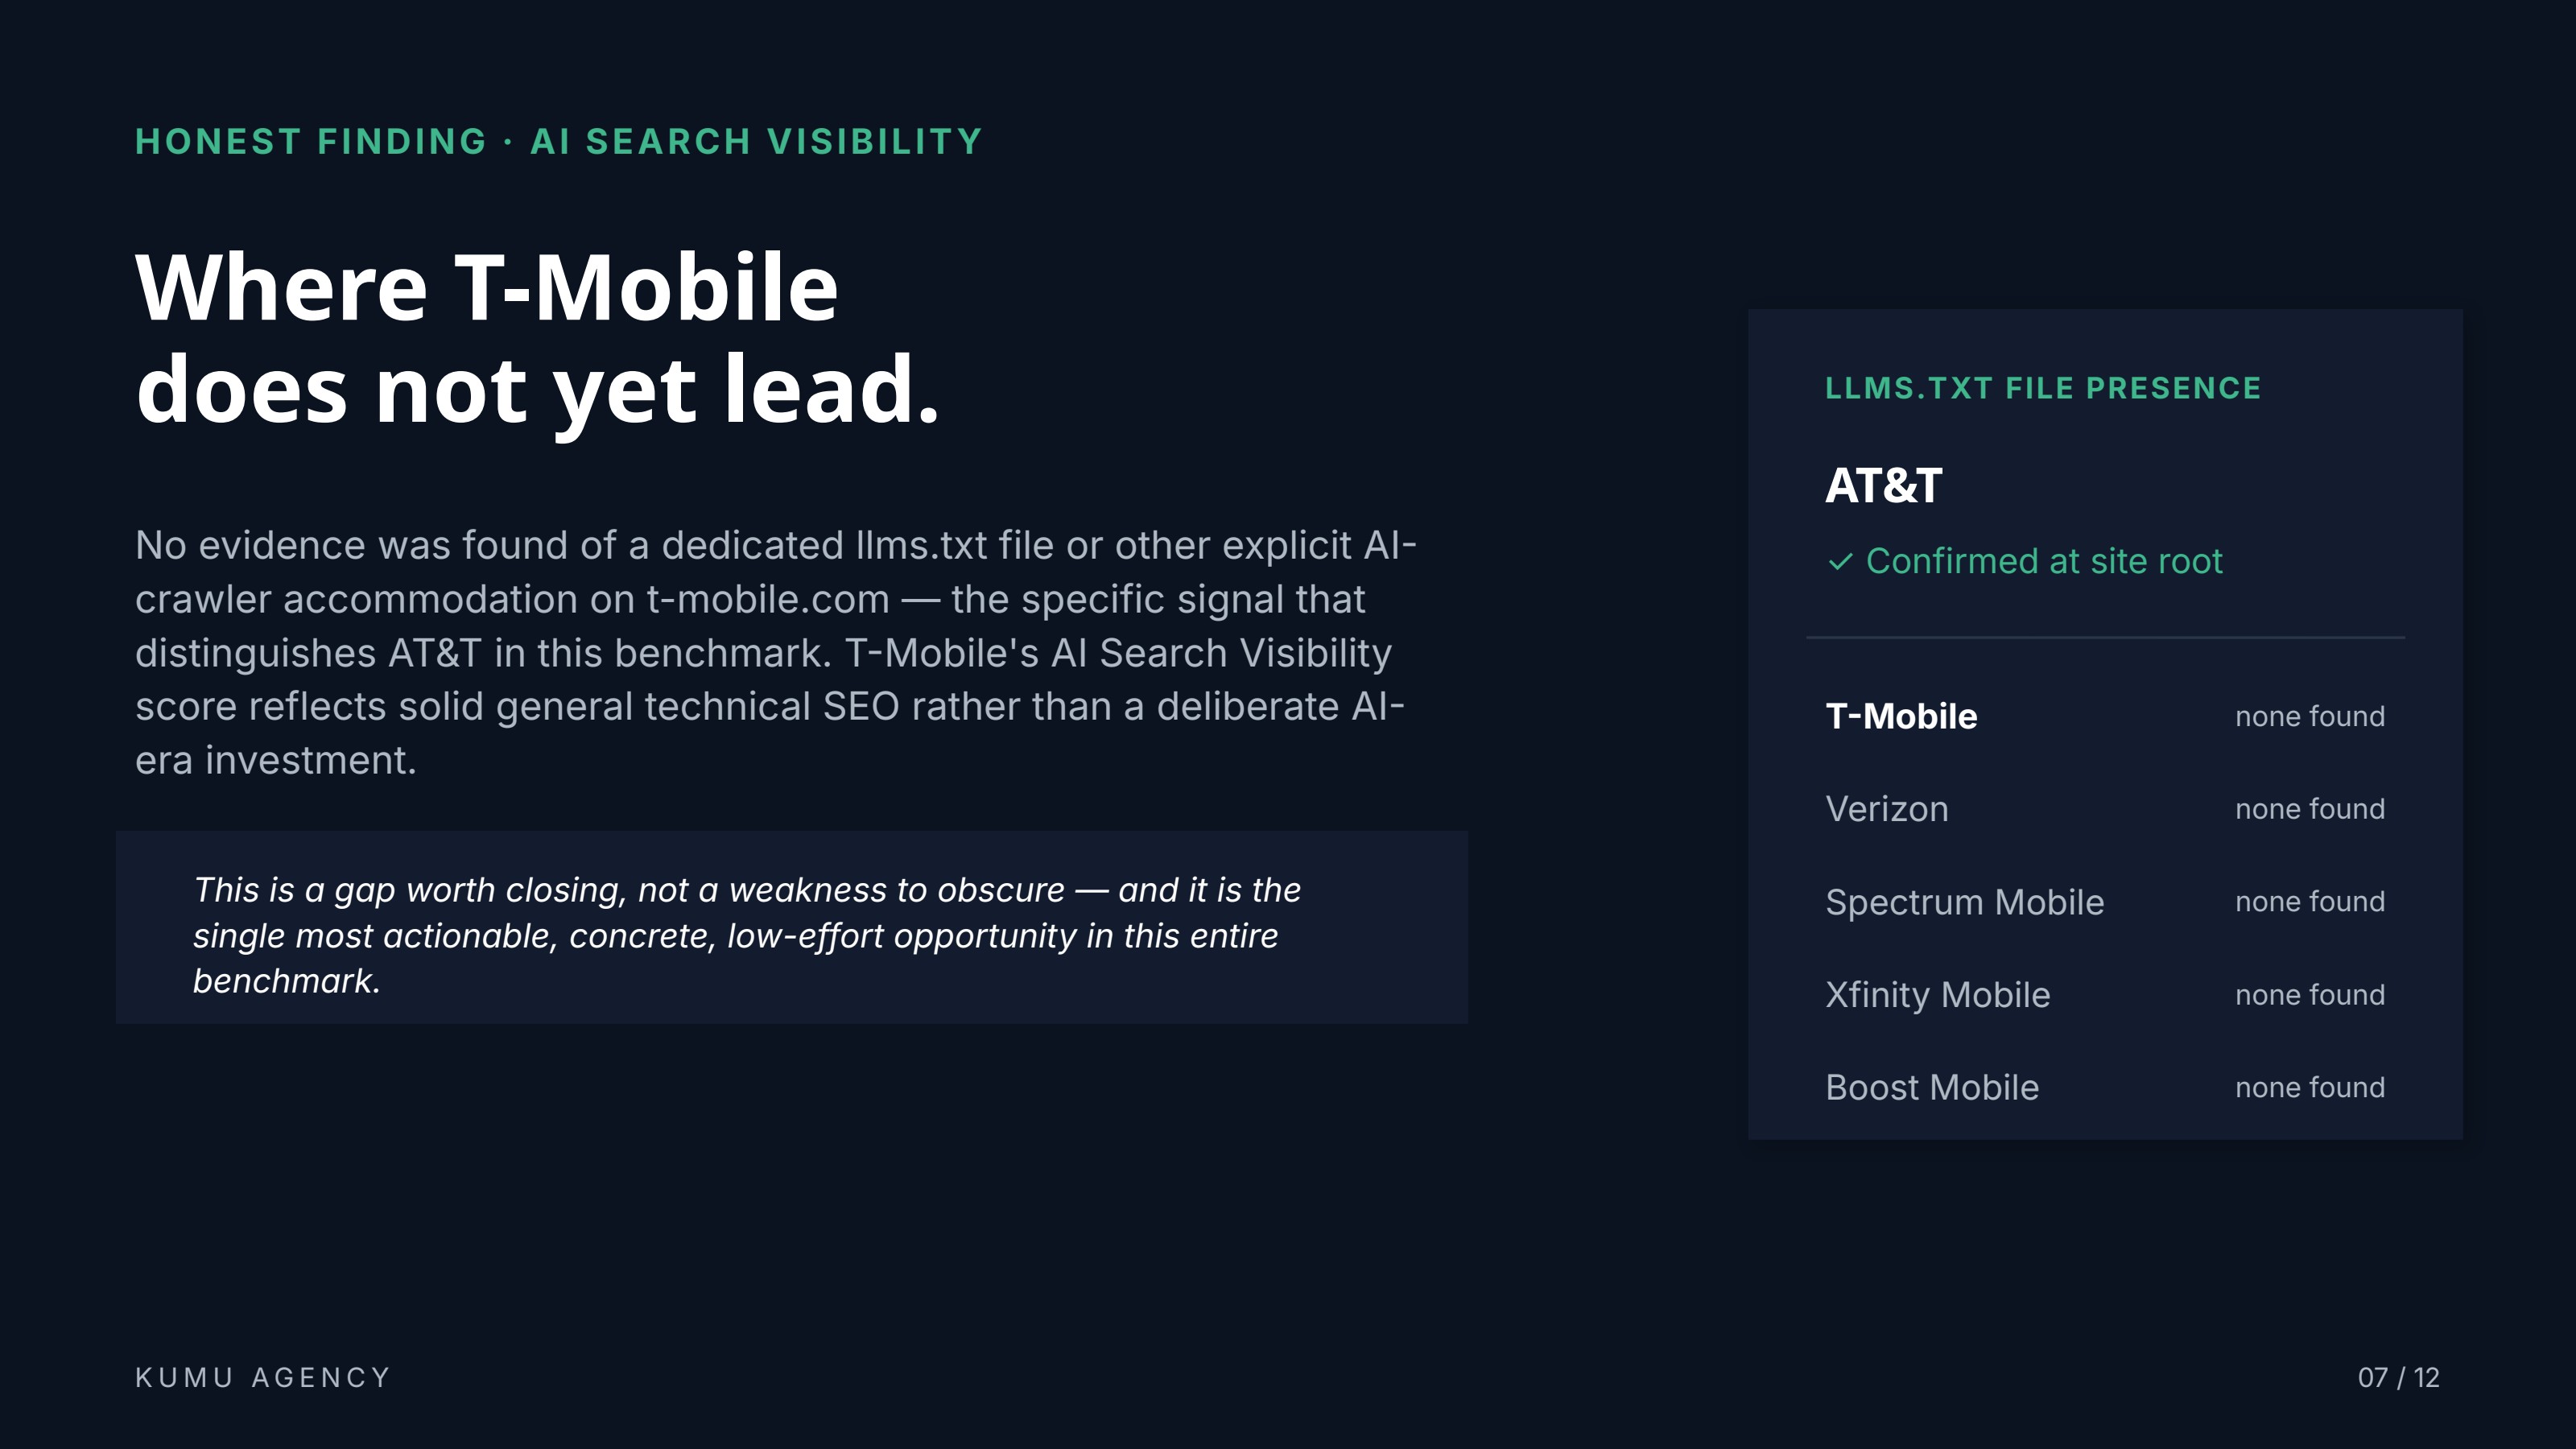
We found no evidence of a dedicated llms.txt file or other explicit AI-crawler accommodation on t-mobile.com — the single signal that distinguishes AT&T in this benchmark. T-Mobile's AI Search Visibility score reflects solid general technical SEO rather than a deliberate AI-era investment. It is the most actionable, lowest-effort, highest-clarity opportunity in the entire benchmark: days of work, not weeks, to close the one gap separating T-Mobile from the leader on the dimension that now decides who gets cited inside the answer.
06
Seven years of compounding work
This isn't our first look at T-Mobile. In 2019 Kumu ran a full competitive UX review benchmarking plans, phones, promotions and the buy flow against Sprint, Verizon and AT&T using Harvey Ball scoring and Nielsen Norman Group usability heuristics. That program — paired with home-page testing, focus groups and quantitative + qualitative user testing — fed a Customer-First Strategy presented to the CMO's leadership team and rewired the workflow between Consumer Insights and Digital so research moved from study to decision to ship in days, not quarters. The 600% lift in retail-to-web sales that came out of that engagement is the foundation T-Mobile's current position is built on.
07
Then → Now
The discipline is continuous: direct site evidence, named competitors, scores that don't flatter the client. In 2019 that meant Harvey Balls against Sprint, Verizon and AT&T. In 2026 it means Workbook and Hand scores against Verizon, AT&T, Spectrum, Xfinity and Boost — and a recommendation to publish an llms.txt file, expand the Dialed In editorial model into switcher-intent topics, and re-benchmark quarterly so score drift is caught early.
08
Outcome
Where T-Mobile was previously a middle-of-the-pack performer carrying disproportionate digital cost, the brand now leads on content freshness, sits second overall in a six-carrier benchmark, and is closing on the leader through a single, days-of-work fix. On the share-of-the-problem we set out to close, T-Mobile now accounts for roughly 2% — against a competitor average above 25%. The work compounds because the measurement compounds.
Results
8.1 / 10
Workbook score (2nd in field)
6
Carriers benchmarked
2%
Share of remaining gap vs. ~25% competitor avg.
600%
Retail-to-web sales lift (2019 program)
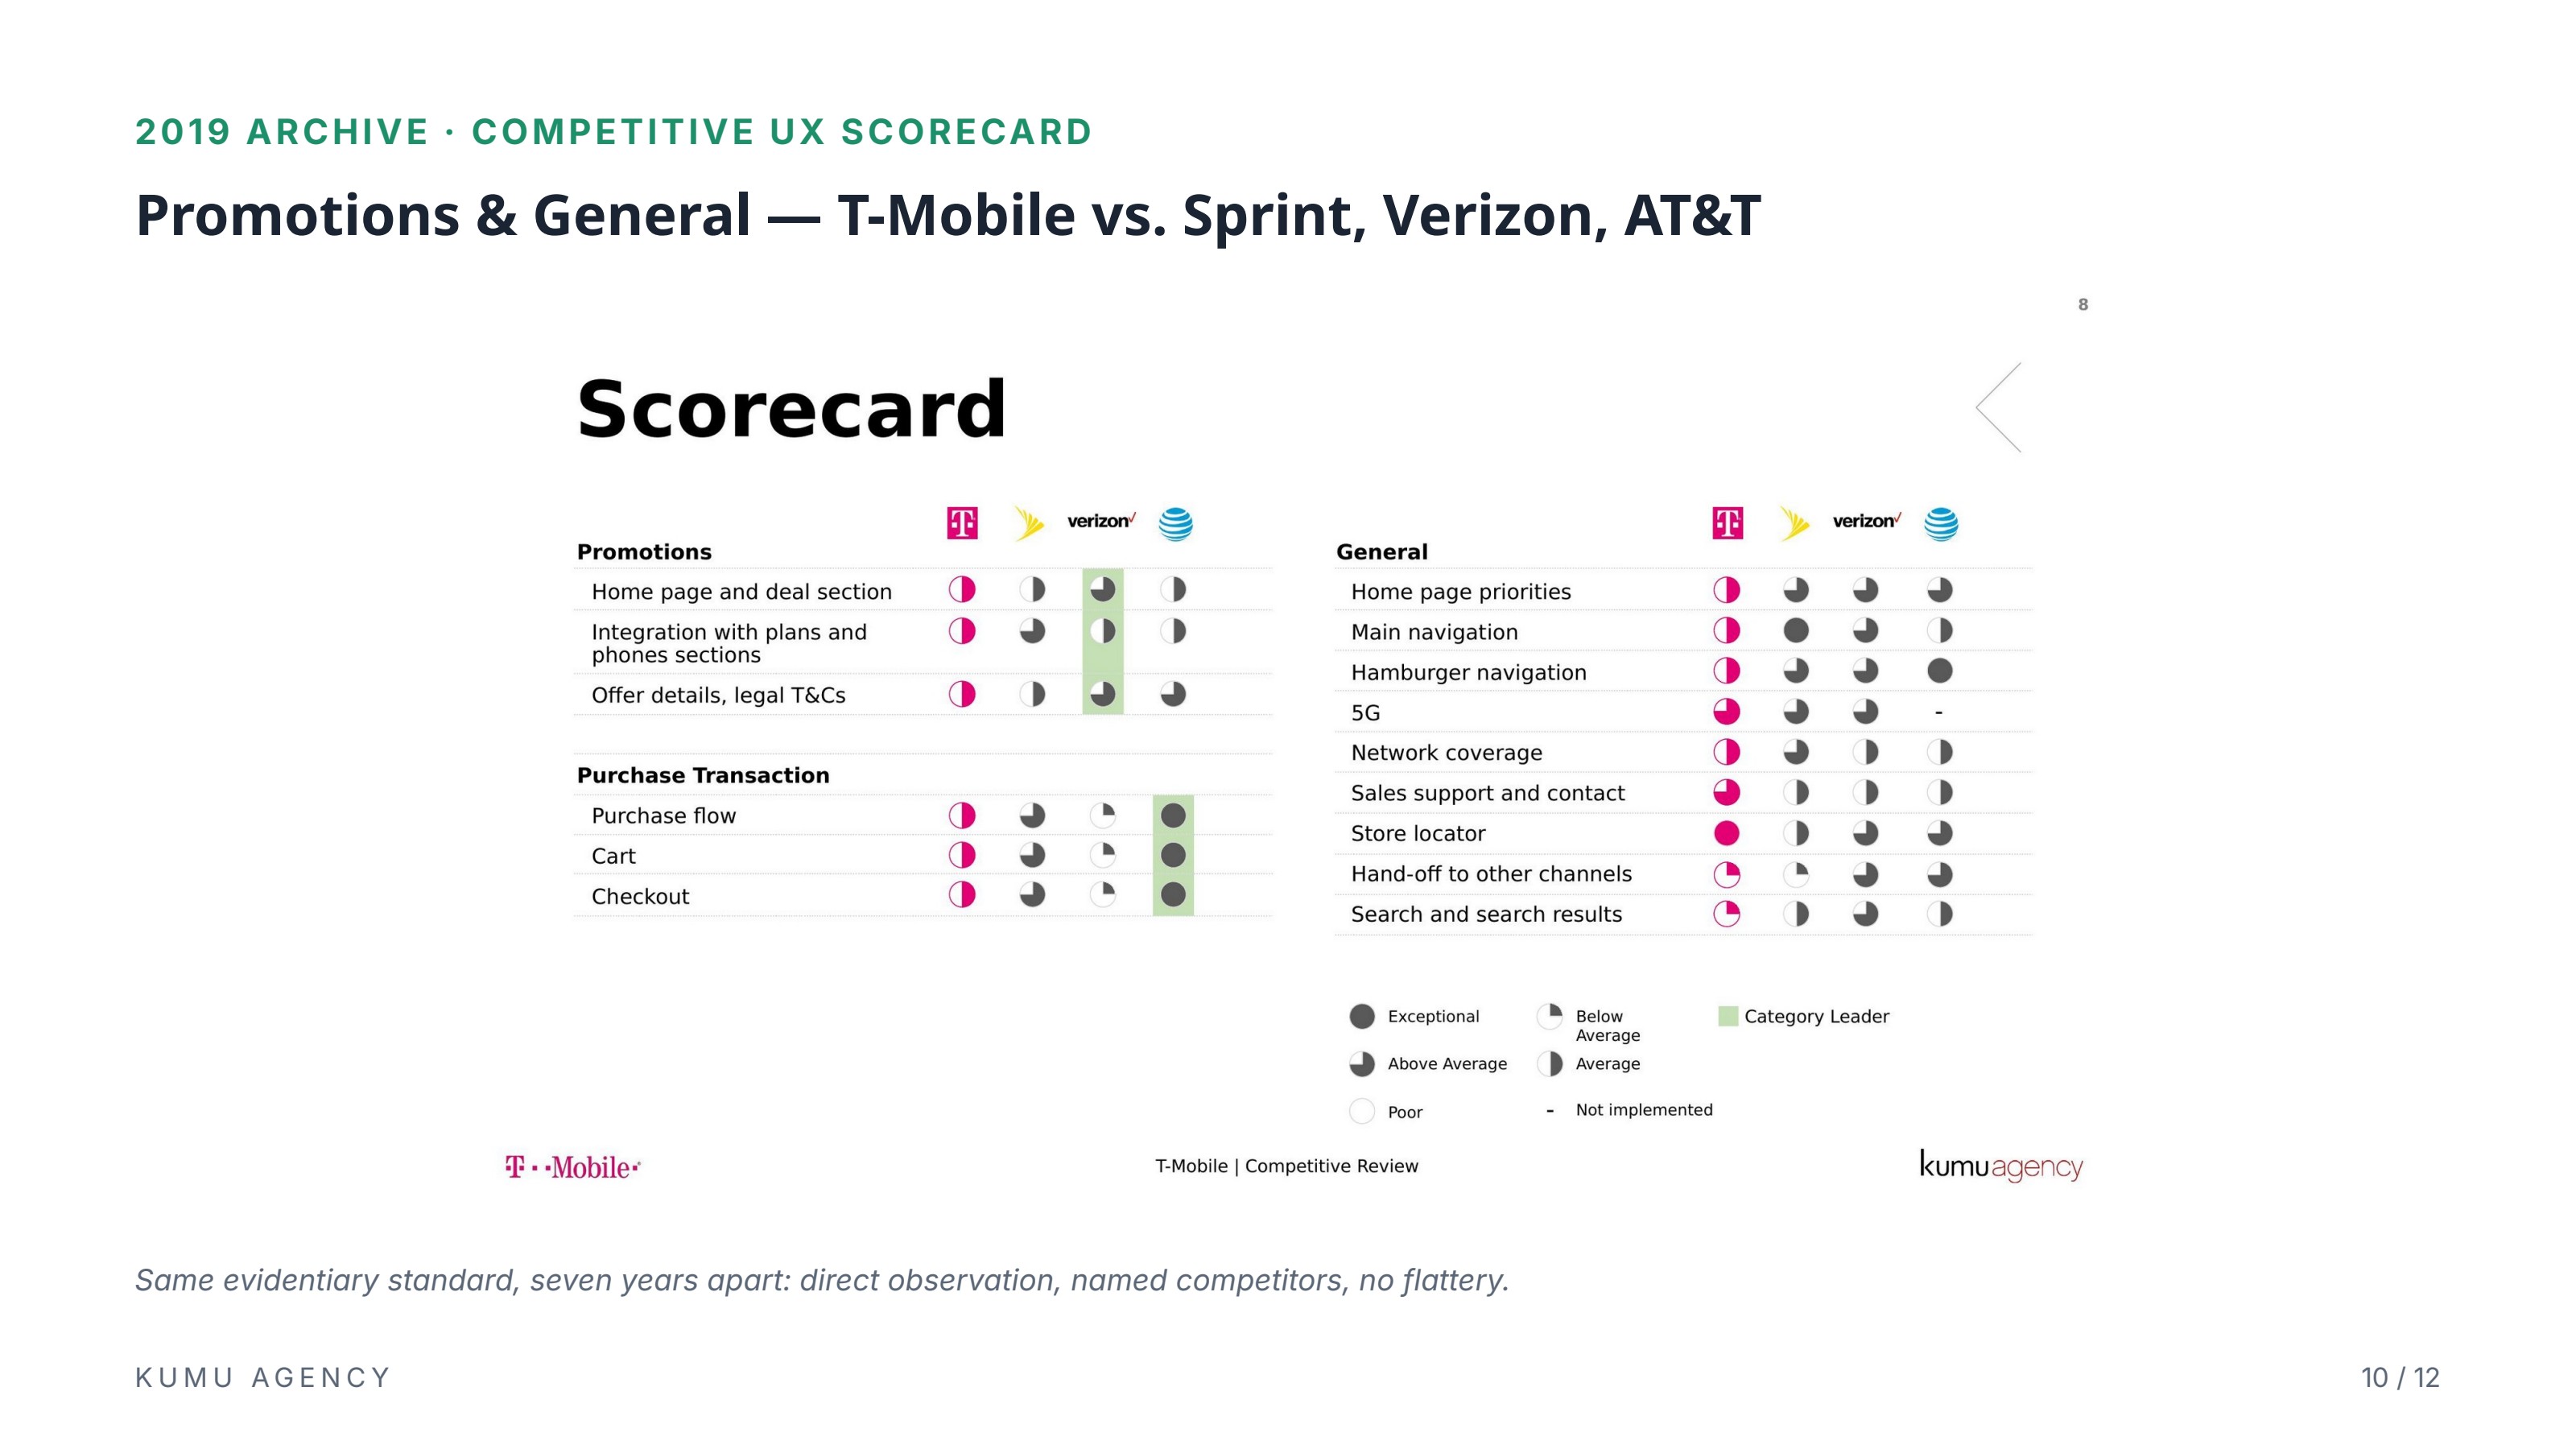
“The same evidentiary standard, seven years apart: direct observation, named competitors, no flattery. That's why the recommendations are usable.”